

Most business owners don't have a data problem. They have a visibility problem. They have dashboards, reports, and a CRM full of numbers — and still can't answer the one question that matters: where is revenue leaking between the inquiry and the booked job? This post names the few metrics that actually answer it.
The reframe: More data is not more clarity. A business can track a hundred metrics and still miss the one number that explains where it's losing money.
Why more data doesn't fix it
When results feel off, the instinct is to measure more. Add a dashboard. Pull another report. Track ten new things. The numbers multiply, the meetings fill with metrics, and leadership somehow understands less, not more.
That's because visibility doesn't come from volume. It comes from relevance. The goal isn't to know everything — it's to clearly see the handful of things that reveal what's actually happening to the demand you already have.
Running on assumptions
"Inquiries are being handled quickly." "Follow-up is happening." "The pipeline looks healthy." Confidence, untested — until the revenue comes in low and nobody can say why.
Running on visibility
You can see response times, where leads stall, and which sources actually produce jobs. Problems surface early, while they're still cheap to fix.
The numbers that actually matter
For a service business, the metrics worth watching all live in the gap between inquiry and booking — because that's where revenue quietly leaks. Six is plenty:
| Metric | What it answers | Why it matters |
|---|---|---|
| Speed to lead (first response time) | How fast do we contact a new inquiry? | The first responder usually wins. This is the biggest single leak point. |
| Lead-to-booking rate | What % of inquiries become booked jobs? | The headline conversion number — it shows how efficiently demand turns into revenue. |
| Response SLA compliance | What % of leads are contacted within our target window? | Tells you whether speed is systemic or just luck. |
| Follow-up completion rate | What % of leads received the full follow-up cadence? | Exposes exactly where follow-up quietly stops. |
| Pipeline velocity (time in stage) | How long do leads sit at each stage? | Surfaces stuck deals before they go cold. |
| Source-to-revenue | Which lead sources produce booked jobs, not just leads? | Stops budget flowing to sources that look busy but don't pay. |
Notice what's not on the list: vanity counts like total impressions or raw lead volume. Those feel like progress without revealing outcomes.
Visibility begins where assumptions end.
Activity is not progress
Plenty of businesses are busy. Meetings happen, emails go out, tasks close. Activity feels like evidence — but it isn't the same as movement. A team can work hard while opportunities stall and the same problems repeat. The metrics above focus on outcomes, not effort, which is exactly why they're uncomfortable and useful.
How to start seeing them
You don't need a new platform. You need three numbers you can trust.
Start with three: pick speed to lead, lead-to-booking rate, and follow-up completion. Instrument them so they're measured automatically — not pulled by hand once a month — then expand only once they're reliable.
The point isn't measurement for its own sake. It's that visibility is the foundation of control: you can't fix a leak you can't see. The same blind spots that hide bad metrics are where revenue quietly disappears. That's the pattern behind most lost revenue. And the fastest place to start watching is response speed — the follow-up system that controls it.
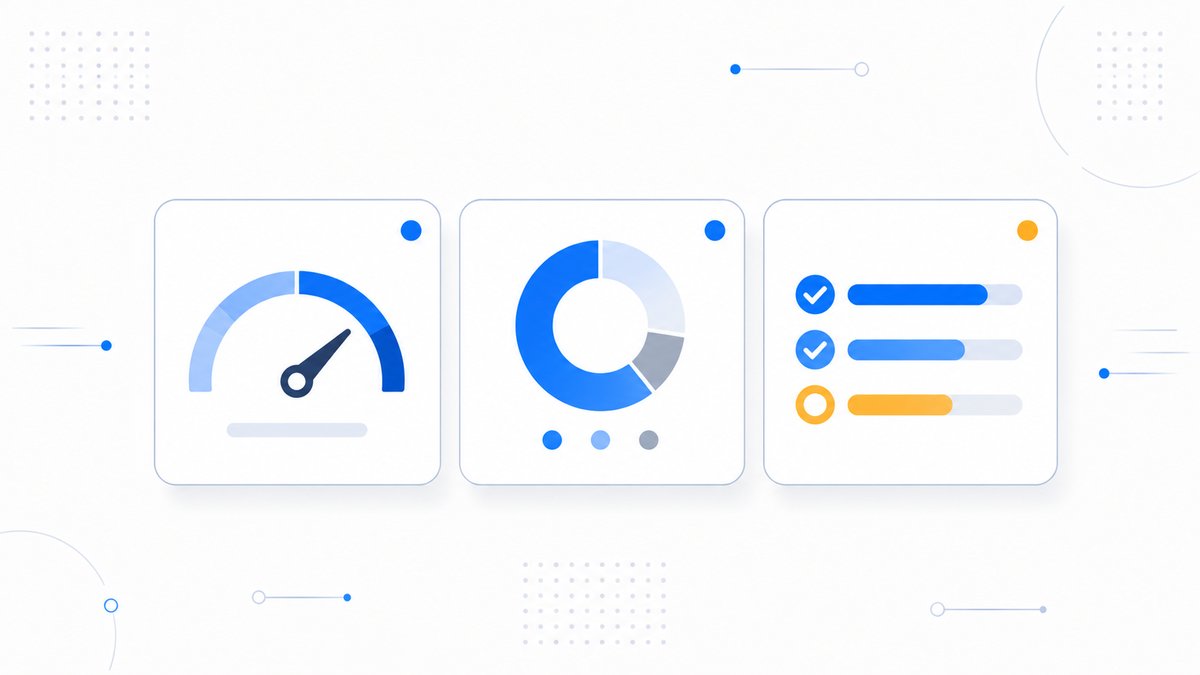
How to calculate the three to start with
You don't need a new platform to begin — just three numbers you can measure consistently. Here's exactly how each is calculated:
| Metric | How to calculate it | What to watch |
|---|---|---|
| Speed to lead | Average time between a new inquiry arriving and your first response | Track the average and the % of leads contacted within your target window (e.g. 5 minutes) |
| Lead-to-booking rate | Booked jobs ÷ total inquiries × 100 | Falling rate = leakage in handling, not a demand problem |
| Follow-up completion rate | Leads that received the full follow-up cadence ÷ total leads × 100 | Low rate shows exactly where follow-up quietly stops |
Measure them automatically. A number you pull by hand once a month is a report. A number the system tracks in real time is visibility. Wire these into your CRM so they update on their own — then expand only once they're reliable.
Skip the vanity counts — total impressions, raw lead volume, hours logged. They feel like progress without revealing whether work turned into revenue.
The real problem
Most businesses don't need more reports. They need to clearly see the few numbers that reflect reality. Get visibility first, and control follows: you spot the leak, you fix the handling, the revenue stops slipping. The order doesn't reverse.